Progress
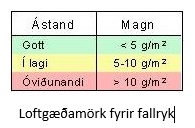
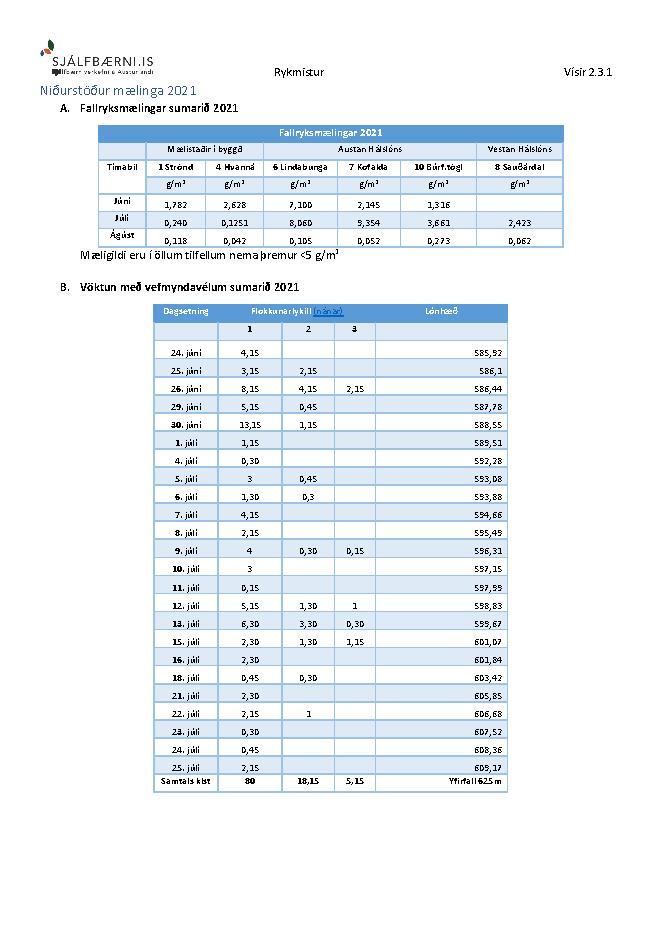
According to regulation 817/2002, particulate air quality limits are the following. A good state = < 5 g/m2 per month, an acceptable 5 - 10 g/m2 per month and an unacceptable state => 10 g/m2 per month. Aeolian deposition and atmospheric dust measurements have been going on for 17 years, and therefore, have gained a decent amount of experience with the operation of the meters and, at the same time, information about aeolian deposition from the coastal areas of Hálslón. Of 633 measurements, the results have three times exceeded >10 g/m2 per month, and in all three cases, the cause was unrelated to the Hálslón reservoir. 625 measurements have been <5 g/m2 per month.
Following are the results of dust density in 2022 and 2021.
The number of days Aeolian was seen and recorded at Hálslón in the summer of 2022 was 24. Hálslón reservoir went on overfall on August 24.
| Period | Inhabited areas | East of Hálslón | West of Hálslón | |||
|---|---|---|---|---|---|---|
| 1 Strönd g/m2 | 4 Hvanná g/m2 | 6 Lindabunga g/m2 | 7 Kofalda g/m2 | 10 Búrf.tögl g/m2 | 8 Sauðárdal g/m2 | |
| June | 0,105 | 0,032 | 0,516 | 0,376 | 0,095 | 0,049 |
| July | 0,944 | 0,466 | 1,160 | 0,930 | 1,047 | 0,813 |
| August | 0,076 | 0,115 | 0,073 | 0,060 | 0,086 | 0,035 |
| Period | Inhabited areas | East of Hálslón | West of Hálslón | |||
|---|---|---|---|---|---|---|
| 1 Strönd g/m2 | 4 Hvanná g/m2 | 6 Lindabunga g/m2 | 7 Kofalda g/m2 | 10 Búrf.tögl g/m2 | 8 Sauðárdal g/m2 | |
| June | 1,782 | 2,628 | 7,100 | 2,145 | 1,316 | |
| July | 0,240 | 0,125 | 8,060 | 9,354 | 3,661 | 2,423 |
| August | 0,118 | 0,042 | 0,105 | 0,052 | 0,273 | 0,062 |
Monitoring by webcams
| Dagsetning | Flokkunarlykill | Lónhæð (m) | |||
|---|---|---|---|---|---|
| 1 | 2 | 3 | 4 | ||
| June 14. | 1,3 | - | - | 592,99 | |
| June 15. | 0,15 | - | - | 593,48 | |
| June 21. | 0,45 | 0,15 | - | 596,62 | |
| July 7. | 3,3 | 1,45 | 1 | 0,15 | 601,9 |
| Total hours | 5,2 | 1,6 | 1 | 0,15 | Overfall 625 |
0,15 = 15 mínútur, 0,30 = 30 mínútur, 0,45 = 45 mínútur
| Date | Classification of measurements | The water level of the reservoir (m) | ||
|---|---|---|---|---|
| 1 | 2 | 3 | ||
| June 24. | 4,15 | - | - | 585,92 |
| June 25. | 3,15 | 2,15 | - | 586,10 |
| June 26. | 8,15 | 4,15 | 2,15 | 586,44 |
| June 29. | 5,15 | 0,45 | - | 587,78 |
| June 30. | 13,15 | 1,15 | - | 588,55 |
| July 1. | 1,15 | - | - | 589,51 |
| July 4. | 0,30 | - | - | 592,28 |
| July 5. | 3,00 | 0,45 | - | 593,08 |
| July 6. | 1,30 | 0,30 | - | 593,88 |
| July 7. | 4,15 | - | - | 594,66 |
| July 8. | 2,15 | - | - | 595,49 |
| July 9. | 4,00 | 0,30 | 0,15 | 596,31 |
| July 10. | 3,00 | - | - | 597,15 |
| July 11. | 0,15 | - | - | 597,99 |
| July 12. | 5,15 | 1,30 | 1,00 | 598,83 |
| July 13. | 6,30 | 3,30 | 0,30 | 599,67 |
| July 15. | 2,30 | 1,30 | 1,15 | 601,07 |
| July 16. | 2,30 | - | - | 601,84 |
| July 18. | 0,45 | 0,30 | - | 603,42 |
| July 21. | 2,30 | - | - | 605,85 |
| July 22. | 2,15 | 1,00 | - | 606,68 |
| July 23. | 0,30 | - | - | 607,52 |
| July 24. | 0,45 | - | - | 608,36 |
| July 25. | 2,15 | - | - | 609,17 |
| Total hours | 80,00 | 18,15 | 5,15 | Overfall 625 |
0,15 = 15 min, 0,30 = 30 min, 0,45 = 45 min
Vöktun við Hálslón
Among other things, given these findings, the focus on monitoring was changed in the summer of 2013. Meters measuring dust deposition per unit area each month were reduced to five. Instead, webcams -based at the north end of the Hálslón reservoir (see figure) were used to evaluate aeolian deposition and atmospheric dust from the reservoir. This method gives frequency, density and magnitude of aeolian dust classified into five categories (1 - 5), where the rising number refers to increased dust density.
- Wind erosion 1
- Wind erosion 2
- Wind erosion 3
- Wind erosion 4
- Wind erosion5
The image examples below explain the classification keys from 1-5, images taken from the webcam on July 13, 20211, except wind erosion 4, which was taken on July 6, 2013.
 |
 |
|
Wind erosion 1 |
Wind erosion 2 Hálsbrún sést öll - Ridge visible Strönd sést greinilega - Coast nearly visible Fjallöxlin hverfur - Mountain shoulder disappearing |
 |
 |
| Wind erosion 3 Mistur komið yfir Hálsbrún - Haze over the ridge Strönd sést varla - Coast nearly visible Sandfell nær horfið - Sandfell almost not disappeared |
Wind erosion 4 |
Updated: October 4, 2023
Source: Landsvirkjun (2023)
Metrics, Targets and Monitoring Protocol
Monitoring Protocol from 2013
Dust meters are set up each spring. In the highlands, the meters are installed as soon as snow melts and the area is passable. Dust meters in populated areas are often installed one month earlier. Information is gathered monthly during summer until the first snow in the fall. Three dust meters are positioned near Hálslón reservoir (no 7:Kofaflói wetland, no 8 Sauðárdalur valley and no 10 Búrfellstögl mountain) and two in inhabited areas (no 1 – Strönd farm and no 4: Hvanná farm).
Webcams positioned at Kárahnjúkar peaks are used to monitor dust pollution. This method gives real-time information about dust pollution's frequency and magnitude in real-time. The webcams can be viewed on Landsvirkjun's homepage.
Monitoring protocol until 2013
Until 2013 average monthly concentration of air particulates was measured using up to 18 monitoring stations.
- Monitoring stations in inhabited areas: Strönd, Hólmatunga, Hvanná, Brú farms.
- Monitoring stations East of Hálslón reservoir: Búrfellstögl mountain, SW of Sandfell mountain, in Lindir springs, Kofaalda hill and Sauðá river.
- Monitoring stations north of Hálslón reservoir: Hafrahvammar canyon, Hallarfjall mountain and Smjörtungur area.
- Monitoring stations in Brúaröræfi wilderness: Fagridalur valley, Arnardalur valley and Breiðastykki area.
Landsvirkjun has planned countermeasures for dust pollution. See indicator 2.2.4 - Sand Encroachment by Hálslón Reservoir.
Targets
Dust will not increase over time in Fljótsdalshérað.
Possible countermeasures
Several methods are available to counteract aeolian deposition; for now, it is just monitored.
Changes of indicator
In the third phase of the Sustainability Initiative, the changes were made in the English version of the indicator that it was considered that the origin of dust should not be examined. The change is because there is no standard method of measuring this.
This indicator was originally number 17.1. It was then named Dust pollution and can be found under that number in documents of the project from 2005 and 2006.
The indicator number has been changed twice.
| Year | Nr. | Indicator name |
|---|---|---|
| 2020 | 2.3.1 | Dust pollution |
| 2007 | 2.12 | Dust pollution |
Baseline

During strong dry winds from south and southwest, dust from the highlands north of the Vatnajökull Glacier is carried north and northeast across the highland plateau and down the lowlands. Under these conditions and during low flow in the Jökulsá á Dal, fine-grained material from dry the river channels and river banks in the lowlands contributes to the amount of suspended material in the air. No unique measurements had been made before baseline data was collected. Still, the baseline condition was assessed by measuring particulates in the air near Hálslón and by the Jökulsá river in Dal up to the time when the effects of the Kárahnjúkar projects started to show. Act No. 817/2002 on air quality limits for particulates states that the concentration of particulates that are not water-soluble must not exceed 10 g/m² per month of collection. The definition of particulates is dust that settles by itself on a humid surface (Act No. 817/2002). Particulate count between 5 and 10 g/m² in 30 days is considered acceptable, and if it is less than 5 g/m², that is considered good.
The graphs below show particulate counts in a few measuring stations in 2006. To see the location of the stations, click here.
Rationale for Indicator Selection
Dust from Halslon Reservoir is a direct project effect monitored in this initiative. However, it could prove difficult to distinguish dust from the reservoir from dust originating from other sources unrelated to the project. During dry, windy days, dust from the highland areas north of Vatnajökul Glacier is carried into the atmosphere. It may, in some cases, impair visibility in the lowlands in northeastern Iceland.
Every year, sediment load from Jökulsá in Dal, which was earlier carried to the sea, settles as a thin layer of silt on the drawdown areas of Hálslón Reservoir. In May, the water level is at its lowest in Hálslón, but in June, it starts rising, so the reservoir is full at the beginning of August. The water level of Hálslón fluctuates in the average year by about 45 metres, but in the dryest years, the fluctuation can be up to 65 metres.
For the first decades, the silt will settle in the reservoir by the glacier roots. During the summer, when the reservoir level is low, the silt may be eroded by strong dry winds from the south or southwest and thus increase the amount of suspended material in the air. The finest grained fraction of the natural soil in the drawdown areas may also contribute. A layer of mist will then be carried to the northeast over the moors and down into populated areas.
When unobstructed, Jökulsá á Dal carries its suspended sediment load to the ocean, leaving some in dry flood channels in the lowlands. Dust originating from these areas will no longer be present.
From phase I/II report on indicators and baseline from April 2005