Progress
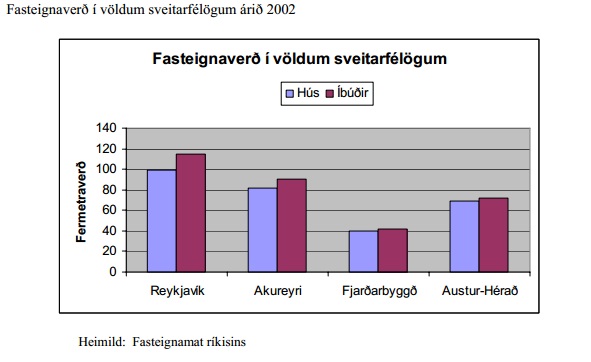
Figure 1. Housing prices in different regions of Iceland from 2001-2023 were calculated with the consumer price index of the year 2023,
Figure 2. The number of sales in different regions of Iceland is compared to the number of sales in 2001.
Figure 3. Average housing price as a percentage of average wage income per year.
Figure 4. The average square meter price in East Iceland compared to the rural areas, the capital region, and the entire country from 2006 to 2024.
Figure 5. The average square meter price of multi-family and single-family and detached housing in the urban areas of Múlaþing compared to East Iceland and Múlaþing as a whole for the years 2006–2024.
Mynd 6. The average square meter price of multi-family, single-family and detached housing in the urban areas of Fjarðabyggð compared to East Iceland and Fjarðabyggð as a whole for the years 2006–2024.
Updated: December 3, 2024
Source:
Metrics, Targets and Monitoring Protocol
What is measured?
Average house price in East Iceland and Nationally compared to changes in average income. (Project effect: indirect).
Monitoring Protocol
Information pulled from data on the website of the Registers Iceland office every year.
Target
Not applicable
Possible countermeasures
Not applicable, monitoring only.
Changes of indicator
This indicator was originally number 6.2. It was then named Cost of living and can be found under that number in documents of the project from 2005 and 2006.
The indicator number has been changed twice.
| Year | Nr. | Indicator name |
|---|---|---|
| 2020 | 3.1.2 | Housing price |
| 2007 | 1.15 | Housing price |
Baseline

Rationale for Indicator Selection
While the Karahnjukar and Fjardaal projects have not only created employment opportunities in the region and raised incomes, the demand for property, goods, and services has also grown, and this development may raise prices. Housing is a major cost factor for most households and is a good indicator of overall cost of living in a region. Migration from the region has resulted in a serious stagnation in the real estate market. An initial increase in property prices might therefore be considered positive, but in the long term it is preferable that housing prices will not increase more rapidly than average income in the region.
From phase I/II report on indicators and baseline from April 2005
