
Progress
Figure 1: Average annual income in thousands ISK, in East Iceland compared to Iceland as a whole. Income calculated with Consumer Price Index 2022. The information is obtained from the tax register. The list calculates the salary of every Icelander aged 16 and older.
Updated: April 1, 2022
Source: RSK
Metrics, Targets and Monitoring Protocol
What is measured?
Average annual salary in East Iceland compared to national average. (Project effect: induced)
Monitoring Protocol
Statistics Iceland publishes information regularly for Iceland as a whole as well as divided by regions.
Target
Equal to or greater than the national average.
Possible countermeasures
Not applicable, monitoring only.
Changes of indicator
This indicator was originally number 6.1a. It was then named Income levels and can be found under that number in documents of the project from 2005 and 2006.
The indicator number has been changed twice.
| Year | Nr. | Indicator name |
|---|---|---|
| 2020 | 3.1.1 | Average income in East Iceland |
| 2007 | 1.14a | Income levels |
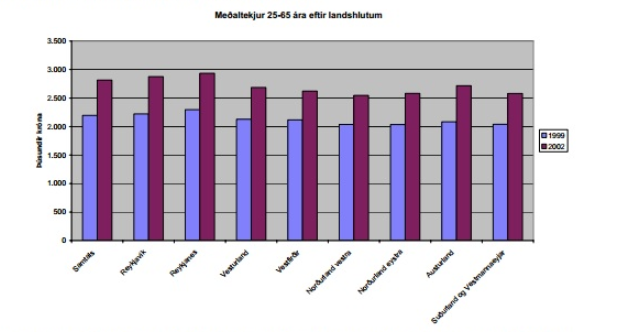
Baseline
Statistics Iceland collects data on average income per year. Information on the baseline situation for the sustainability project includes figures from 1999 and 2002 to show the development as it was before construction began, but average income in all parts of the country has risen significantly during this period. Income in the east is somewhat lower than income in the capital area. However, this applies to most areas outside the southwestern corner and the average income in East Iceland is actually somewhat higher than in other areas outside the capital.
Rationale for Indicator Selection
Average income level is a useful indicator of an area's comparative financial welfare and prosperity. The development of the Kárahnjúkar and Fjarðaál projects is likely to have an impact on per capita income levels for the area.The development will provide direct income effects to employees and their families as well as supporting indirect income effects through firms supplying goods and services and the additional employees in the region.
From phase I/II report on indicators and baseline from April 2005