Progress
Fluoride concentration in vegetation (including ruminant forage) at designated sample plots within a specified radius of the smelter.
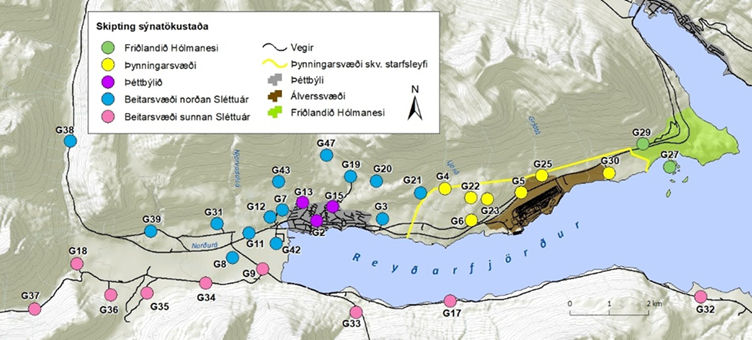
Figure 1. The division of sampling points into five different areas (Landmælingar Íslands, 2013 and 2015).
Labels: Hólmanes reserve (Friðlandið Hólmanesi), Dilution area (þynningarsvæði), Urban area (Þéttbýlið), Grazing area and fields north of Sléttuá river (Beitarsvæði og tún norðan Sléttuár), Grazing area and fields south of Sléttuá river (Beitarsvæði og tún sunnan Sléttuár).
Updated: May 5, 2022
Source: Alcoa Fjarðaál (2022)
Results 2004-2005 and 2014-2021
Fluoride in grass
Figure 2. The average concentration of fluoride (µg/g) in dry weight of grass (with standard error) in different areas in Reyðarfjörður in 2004 - 2005 (baseline, average of two samples taken, one each year) and 2014 - 2021. Number of sampling sites: Number of sampling sites: 2004 - 2005 (n-30), 2014 - 2016 (n-34) and 2017-2021 (n-35).
Note that the sampling sites were changed in 2013 and 2014; 11 sites were added in 2013, 7 were removed in 2014, and one was added in 2017.
Updated: May 5, 2022
Source: Alcoa Fjarðaál (2022)
Sulphur in grass
Figure 3. The average concentration of sulfur (%) in dried samples of grass from 30 stations in Reyðarfjörður in the years 2004 (background value), 2005, 2007-2010, 2015, 2018 and 2021.
Updated: May 5, 2022
Source: Alcoa Fjarðaál (2022)
Fluoride in moss
Figure 4. The pattern of fluoride in moss (µg/g) in 2004 (background level) and 2014- 2021. Directions: A: East, V: West, and S: South and distance (km) from smelter chimney. The number of samples is displayed in parenthesis, and the standard error of the average is also shown.
Updated: May 5, 2022
Source: Alcoa Fjarðaál (2022)
Fluoride in lichens
Figure 5. Distribution pattern of fluoride in lichens (µg/g) from 2004 (background level) and 2014 -2021. Direction: A-East, V-West, and S-South and distance from smelter chimney. The number of samples is given in parenthesis, and the standard error of the average is also shown.
Updated: May 5, 2022
Source: Alcoa Fjarðaál (2022)
Fluoride in leaves of bog bilberries
Figure 6. Distribution pattern of fluoride (µg/g) in leaves of bog bilberries from the year 2004 (background level) and 2014 - to 2021. Directions: A-East, V-West, and S-South and distance (km) from smelter chimney. The number of samples is given in parenthesis, and the standard error of the average is also shown.
Updated: May 5, 2022
Source: Alcoa Fjarðaál (2022)
Fluoride in leaves of the rowan
Updated: May 5, 2022
Source: Alcoa Fjarðaál (2022)
Fluoride in coniferous leaves
Figure 8. Annual average of fluoride (µg/g) in coniferous leaves (with standard error) in the year 2004 (background level) and 2014 to 2021 in Reyðarfjörður. The data is based on ten samples in 2004 and 9 samples from 2014 to 2021. The year on the horizontal axis is a reference to the sampling year.
Updated: May 5, 2022
Source: Alcoa Fjarðaál (2022)
Fluoride in berries
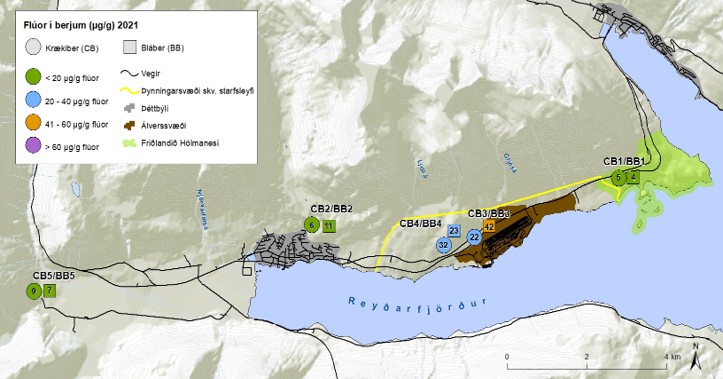
Figure 9. The concentration of fluoride in bog bilberries and northern crow-berries (µg/g) in 5 sampling sites in Reyðarfjörður in summer 2021. One sample was taken at each sampling site.
Labels:
Bláber: bog bilberries
Krækiber: northern crowberries
Vegir: roads
Þynningarsvæði skv. starfsleyfi: dilution area according to business license
Þéttbýli: urban area
Álverssvæði: smelter site
Friðlandið Hólmanesi: Hólmanes reserve
Figure 10. The concentration of fluoride (µg/g) in dry weight of bog berries and northern crowberries from 5 sampling sites in Reyðarfjörður 2006 and 2014-2021. Until 2011, the limit of analytical determination for fluoride in northern crowberries was 5 µg/g.
Updated: May 5, 2022
Source: Alcoa Fjarðaál (2022)
Fluoride in rhubarb
Figure 12. The annual average concentration of fluoride (µg/g) in dry weight of rhubarb from 2004-2005 (background level, the average of both years) and 2014-2021 in Reyðarfjörður. The number of samples is given in brackets. Also shown is the standard error of the average. During the years 2004 and 2005, one sampling tour was taken, and three sampling tours were taken in the years 2014-2021.
Updated: May 5, 2022
Source: Alcoa Fjarðaál (2022)
Fluoride in potatoes
Figure 12. The average fluoride concentration (µg/g) in potatoes and potato leaves from three sampling sites in the summers of 2004 and 2014 - 2021.
Updated: May 5, 2022
Source: Alcoa Fjarðaál (2022)
Metrics, Targets and Monitoring Protocol
What is measured?
Concentration of F in vegetation (including ruminant forage) at designated sample plots within a specified radius of smelter (Project effect: direct)
Monitoring Protocol
Sýni tekin á skilgreindum stöðum á vaxtartímabili:
- 40 samples of coniferous leaves, broadleaves, vegetables and vegetable leaves collected in Reyðarfjörður (ten samples for each vegetation type) and analyzed for F, N, S and heavy metals
- 30 samples of forage grass collected in Reyðarfjörður and analyzed for F and S/N ratio
- Mosses, lichens, and broadleaf plant collected from 30 stations and analyzed for F
- Lichen on rock photographed at 50 locations in Reyðarfjörður
- Ecological survey:
- Vegetative species composition and vegetation cover (%) recorded in 150 vegetation quadrats in 30 sample stations around Reydarfjorduri
- Quadrats photographed.
- Vegetation in Reyðarfjörður visually inspected for fluoride impact.
Data collection:
- Baseline sampling conducted from 2004 - 2005
- Lichen (plots) and vegetation quadrats photographed annually from 2004 - 2008
- Vegetation visually inspected once a year from 2004 - 2008
- 2007 and 2008 samples collected every month during the growing season for up to six months:
- 30 each for moss, lichens, broadleaves and forage grass
- 10 each for conifer (previous year growth), 10 conifer (new growth), broadleaf tree tissue and vegetable
- 2007 and 2008 ecological survey in 150 quadrats.
Targets
- Coniferous leaves, broadleaves, and vegetables: >0.4 µg/m3
- Grasses: >3 µg/m3
- Lichens & Mosses: >0.3 µg/m3
Source: AW Davidson and L. Weinstein; EIA, 2001
Possible countermeasures
Alcoa Fjarðaál has direct effect by its operations. Targets are set to be met.
See more:
Changes of indicator
The original metric was „Concentration of F (µg/kg-DW) in vegetation (ruminant forage and berries) at designated sample plots within a specified radius of smelter“. Based on expert consultation (Alan W. Davison & Len H. Weinstein) measuring unit and berries was removed from metric. The changed metric is: „Concentration of F in vegetation (including ruminant forage) at designated sample plots within a specified radius of smelter“
This indicator was originally number 21.1. It was then named Fluoride in Vegetation and can be found under that number in documents of the project from 2005 and 2006.
The indicator number has been changed twice.
| Year | Nr. | Indicator name |
|---|---|---|
| 2020 | 2.6.1 | Fluoride in Vegetation |
| 2007 | 2.27 | Fluoride in Vegetation |
Baseline
The background level of fluoride in vegetation varies with soil, species, type of leaf, age and the presence of natural sources of fluoride such as dust. It is therefore impossible to state precise background concentrations of fluoride. However, the scientific literature shows that most samples are <5 μg F/ g (dry wt), a proportion may have up to 10 and some may have as high as 20 or so μg F/ g. Fruit, stalks and roots have much lower fluoride content than leaves.
| Sample | Number of analysed samples | Number of samples with |
Maximum F content |
||
|---|---|---|---|---|---|
|
2004 |
F < 5 μg/g | 6-10 μg/g | 11-20 μg/g | μg/g | |
| Conifer (Pinus, Picea) | |||||
| Current year | 10 | 10 | 0 | 0 | <3 |
| Previous year | 10 | 10 | 0 | 0 | 4 |
| Broadleaf tree (rowan, Sorbus aucuparia) | 10 | 9 | 0 | 0 | 21 |
| Vegetables | |||||
| Strawberry fruit | 1 | 0 | 1 | 0 | 10 |
| Strawberry leaves | 2 | 1 | 1 | 0 | 6 |
| Rhubarb stalks | 4 | 4 | 0 | 0 | <3 |
| Rhubarb leaves | 4 | 0 | 0 | 2 | 94 |
| Potato tubers | 5 | 5 | 0 | 0 | <3 |
| Potato leaves | 5 | 2 | 1 | 2 | 16 |
|
Grass |
30 | 29 | 1 | 0 | 6 |
|
2005 |
|||||
| Broadleaf, wild species | 30 | 28 | 1 | 1 | 11 |
| Vegetables | |||||
| Rhubarb Stalks | 10 | 10 | 0 | 0 | <5 |
| Rhubarb leaves | 10 | 2 | 0 | 3 | 111 |
| Potato leaves | 2 | 1 | 1 | 0 | 6 |
| Grass | 30 | 25 | 5 | 0 | 10 |
| Moss | 30 | 12 | 12 | 5 | 29 |
| Lichen | 30 | 26 | 4 | 0 | 8 |
Interpretation
Most analyses fell within the expected range for background samples. One sample of rowan, most rhubarb leaves (not stalks, the edible part) and some moss samples contained higher fluoride concentrations than expected. One sample of strawberry fruit had slightly higher fluoride content than expected and so did some potato leaves. These deviations were investigated in 2004 and 2005 and it was concluded that:
- The slightly high fluoride concentration in the strawberry fruit and potato leaves was probably due to dust / soil contamination. Washing fruit usually removes this material.
- The one high rowan sample was due to contamination from burning waste near sampling site.
- The high fluoride concentrations in rhubarb leaves were due to the fact that it is one of a small number of species that can accumulate fluoride from the soil. This was not previously known. Note that the edible stalks had low fluoride contents.
- The elevated fluoride in the moss samples correlated with the presence of sources of dust from construction and roads (all dust and soil debris contains measurable amounts of fluoride).
Rationale for Indicator Selection
Fluoride can adversely affect the growth and vitality of vegetation. Fluoride emitted from the Fjarðaál smelter could accumulate in vegetation in the immediate vicinity of the smelter. Communities in East Iceland are concerned about the changes in their ecosystem if fluoride emissions exceed the tolerance threshold of local plants. Fluoride can directly impact vegetation and could cause the localized extirpation of sensitive floral species. Fluoride accumulation is also hazardous to grazing mammals. Vegetation could accumulate fluorides in concentrations that are hazardous to herbivorous mammals, and this in turn could influence humans if they eat those mammals.
From phase I/II report on indicators and baseline from April 2005
Further reading

You can view more material related to the indicator by clicking on the link above.


