
Progress

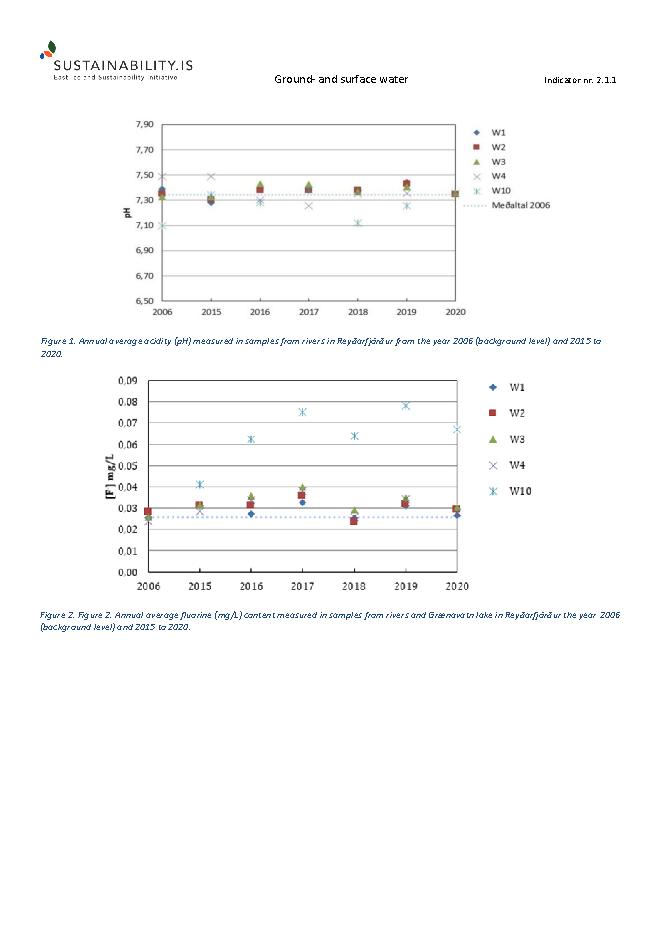
Figure 1. Annual average acidity (pH) was measured in samples from rivers in Reyðarfjörður from the year 2006 (background level) and 2015 to 2021.
 í árvatnssýnum og Grænavatni í Reyðarfirði fyrir árin 2006 og 2015 til 2020.")
Figure 2. Annual average fluorine (mg/L) content was measured in samples from rivers and Grænavatn lake in Reyðarfjörður from the year 2006 (background level) and 2014 to 2021.

Figure 3. Sampling locations (W1, W2, W3, and W4) for water and snow in Reyðarfjörður.
| Acidity (pH) | Fluorine (F) | |
|---|---|---|
| 2007 | 7,39 | 0,034 |
| 2008 | 7,22 | 0,034 |
| 2009 | 7 | 0,077 |
| 2010 | 7,07 | 0,05 |
| 2011 | 7,01 | 0,05 |
| 2012 | 7,29 | 0,031 |
| 2013 | 7,27 | 0,038 |
| 2014 | 7,41 | 0,024 |
| 2015 | 7,32 | 0,031 |
| 2016 | 7,41 | 0,032 |
| 2017 | 7,39 | 0,037 |
| 2018 | 7,35 | 0,028 |
| 2019 | 7,43 | 0,033 |
| 2020 | 7,36 | 0,029 |
| 2021 | 7,35 | 0,030 |
Updated: May 5, 2022
Source: Alcoa Fjarðaál (2022)
Metrics, Targets and Monitoring Protocol
What is measured?
Concentrations (mg/l) of phosphorous (P), fluoride (F), chlorine (Cl), and sulfate (SO4) in groundwater and surface water at established sample locations at the smelter site and near the smelter outfall. (Project effect: indirect).
Monitoring Protocol
Soil samples (groundwater) will be collected and analyzed for concentration of F, Cl, SO4, and pH (sampling protocols yet to be determined as per A. W. Davison)
- Surface water is collected and analyzed for concentrations of F, SO4, Cl, heavy metals, PAH-16, alkalinity, and pH.
Data is collected according to this schedule:
- Groundwater: Every year 2004-2008.
- Surface water: Every three months from 2005-2008.
- Surface snow and snowmelt: Every year from 2005-2008.
Target
Targets for constituents in surface water and groundwater to be based on baseline study results.
Possible countermeasures
The companies can arrange their activity and make improvements if pollution is over permissive limits.
Changes of indicator
This indicator was originally number 22.2. It was then named Groundwater and Surface Water Quality at the Smelter and can be found under that number in the project documents from 2005 and 2006.
The indicator number has been changed twice.
| Year | Nr. | Indicator name |
|---|---|---|
| 2020 | 2.1.1 | Groundwater and surface water |
| 2007 | 2.1 | Groundwater and surface water quality at the smelter |
Baseline
Figure 4. Annual average acidity (pH) measured in samples from rivers in Reyðarfjörður, 2005-2007.
Rationale for Indicator Selection
Currently, 95% of the freshwater used in Iceland is untreated groundwater. The remaining freshwater is a combination of treated and untreated surface water. Because the majority of the Icelandic population uses untreated potable water, maintaining acceptable water quality standards is vital to the sustainability of the local communities. The presence of industrial facilities creates the potential for direct contamination of local groundwater. All facility discharges (solid, liquid, gaseous) have the potential to influence water quality.
From phase I/II report on indicators and baseline from April 2005
Further reading
You can view more material related to the indicator by clicking on the link above.