
Progress
It is vital to determine a baseline for hydrological measurements to assess the impact of the plant. Annual fluctuation in water level and discharge is shown for Jökulsá á Dal River (flow by Hjarðarhagi) and in Jökulsá í Fljótsdal River and Lagarfljót River.
The “Baseline” section contains figures showing all possible flow positions in a specified period before the Kárahnjúkar Power Plant started. It also offers annual variation and average water level and flows before the power station construction affected the major rivers. The exact figures are used for the corresponding measurements from year to year after constructing the power plan.
Location 1: Annual discharge fluctuation in Jökusá á Dal River by Hjarðarhagi, VHM 110
 before construction of Kárahjúkavirkjun power plant 1963 - 2006 and measured discharge 2023.")
Figure 1. Annual discharge fluctuation in Jökulsá á Dal river by Hjarðarhagi (vhm 110) before construction of Kárahjúkavirkjun power plant 1963 - 2006 and measured discharge 2023.
 after construction of Kárahjúkavirkjun power plant 2008 - 2022 and measured discharge 2023.")
Location 2: Annual discharge fluctuation in Jökulsá í Fljótsdal River by Hóll
 before construction of Kárahnjúkavirkjun power plant 1962 - 2006 and measured discharge 2023")
Figure 3. Annual discharge fluctuation in Jökulsá í Fljótsdal river by Hóll (vhm 109) before construction of Kárahnjúkavirkjun power plant 1962 - 2006 and measured discharge 2023
 after construction of Kárahjúkavirkjun power plant 2008 - 2022 and measured discharge 2023")
Location 3: Lagarfljót River by Lagarfoss
 before construction of Kárahnjúkavirkjun power plant 1975 - 2006 and measured discharge 2023.")
Figure 5. Annual discharge fluctuation in Lagarfljót river by Lagarfoss (vhm 325/V325) before construction of Kárahnjúkavirkjun power plant 1975 - 2006 and measured discharge 2023.
 after construction of Kárahnjúkavirkjun power plant 2008 - 2022 and measured discharge 2023")
Figure 6. Annual discharge fluctuation in Lagarfljót river by Lagarfoss (vhm 325/V325) after construction of Kárahnjúkavirkjun power plant 2008 - 2022 and measured discharge 2023.
 before construction of Kárahnjúkavirkjun power plant 1977 - 2006 and measured level in 2023.")
Figure 7. Annual water level fluctuations in Lagarfljót river by Lagarfoss (vhm 17/V505) before construction of Kárahnjúkavirkjun power plant 1977 - 2006 and measured level in 2023.
 after construction of Kárahnjúkavirkjun power plant 2008 - 2022 and measured water level 2023.")
Location 4: Water level fluctuations in Lagarfljót River by Egilsstaðir (Lagarfell)
 before construction of Kárahnjúkavirkjun power plant 1997-2006 and water level measurements 2023.")
Figure 9. Annual water level fluctuation in Lagarfljót river by Egilsstaðir (Lagarfell, vhm 7/V7) before construction of Kárahnjúkavirkjun power plant 1997-2006 and water level measurements 2023.
 after construction of Kárahnjúkavirkjun power plant 2008-2022 and water level measurements 2023.")
Figure 10. Annual water level fluctuations in Lagarfljót river by Egilsstaðir (Lagarfell, vhm 7/V7) after construction of Kárahnjúkavirkjun power plant 2008-2022 and water level measurements 2023.
Updated: October 10, 2024
Source: Landsvirkjun 2024.
Metrics, Targets and Monitoring Protocol
What is measured?
Water levels and discharge at gauging stations in rivers. (Project effect: indirect).
The purpose of measurements is i.a. to analyze the effects of the operation of the power plant from natural fluctuations.
Monitoring Protocol
Ever since Fljótsdalur Power Station started operation, many gauges have been set up and monitored to determine the flow into the station. The gauges measure the water level at the location, and this data is calculated into flow with so-called flow keys. A number of these gauges are now operated to monitor changes in the flow.
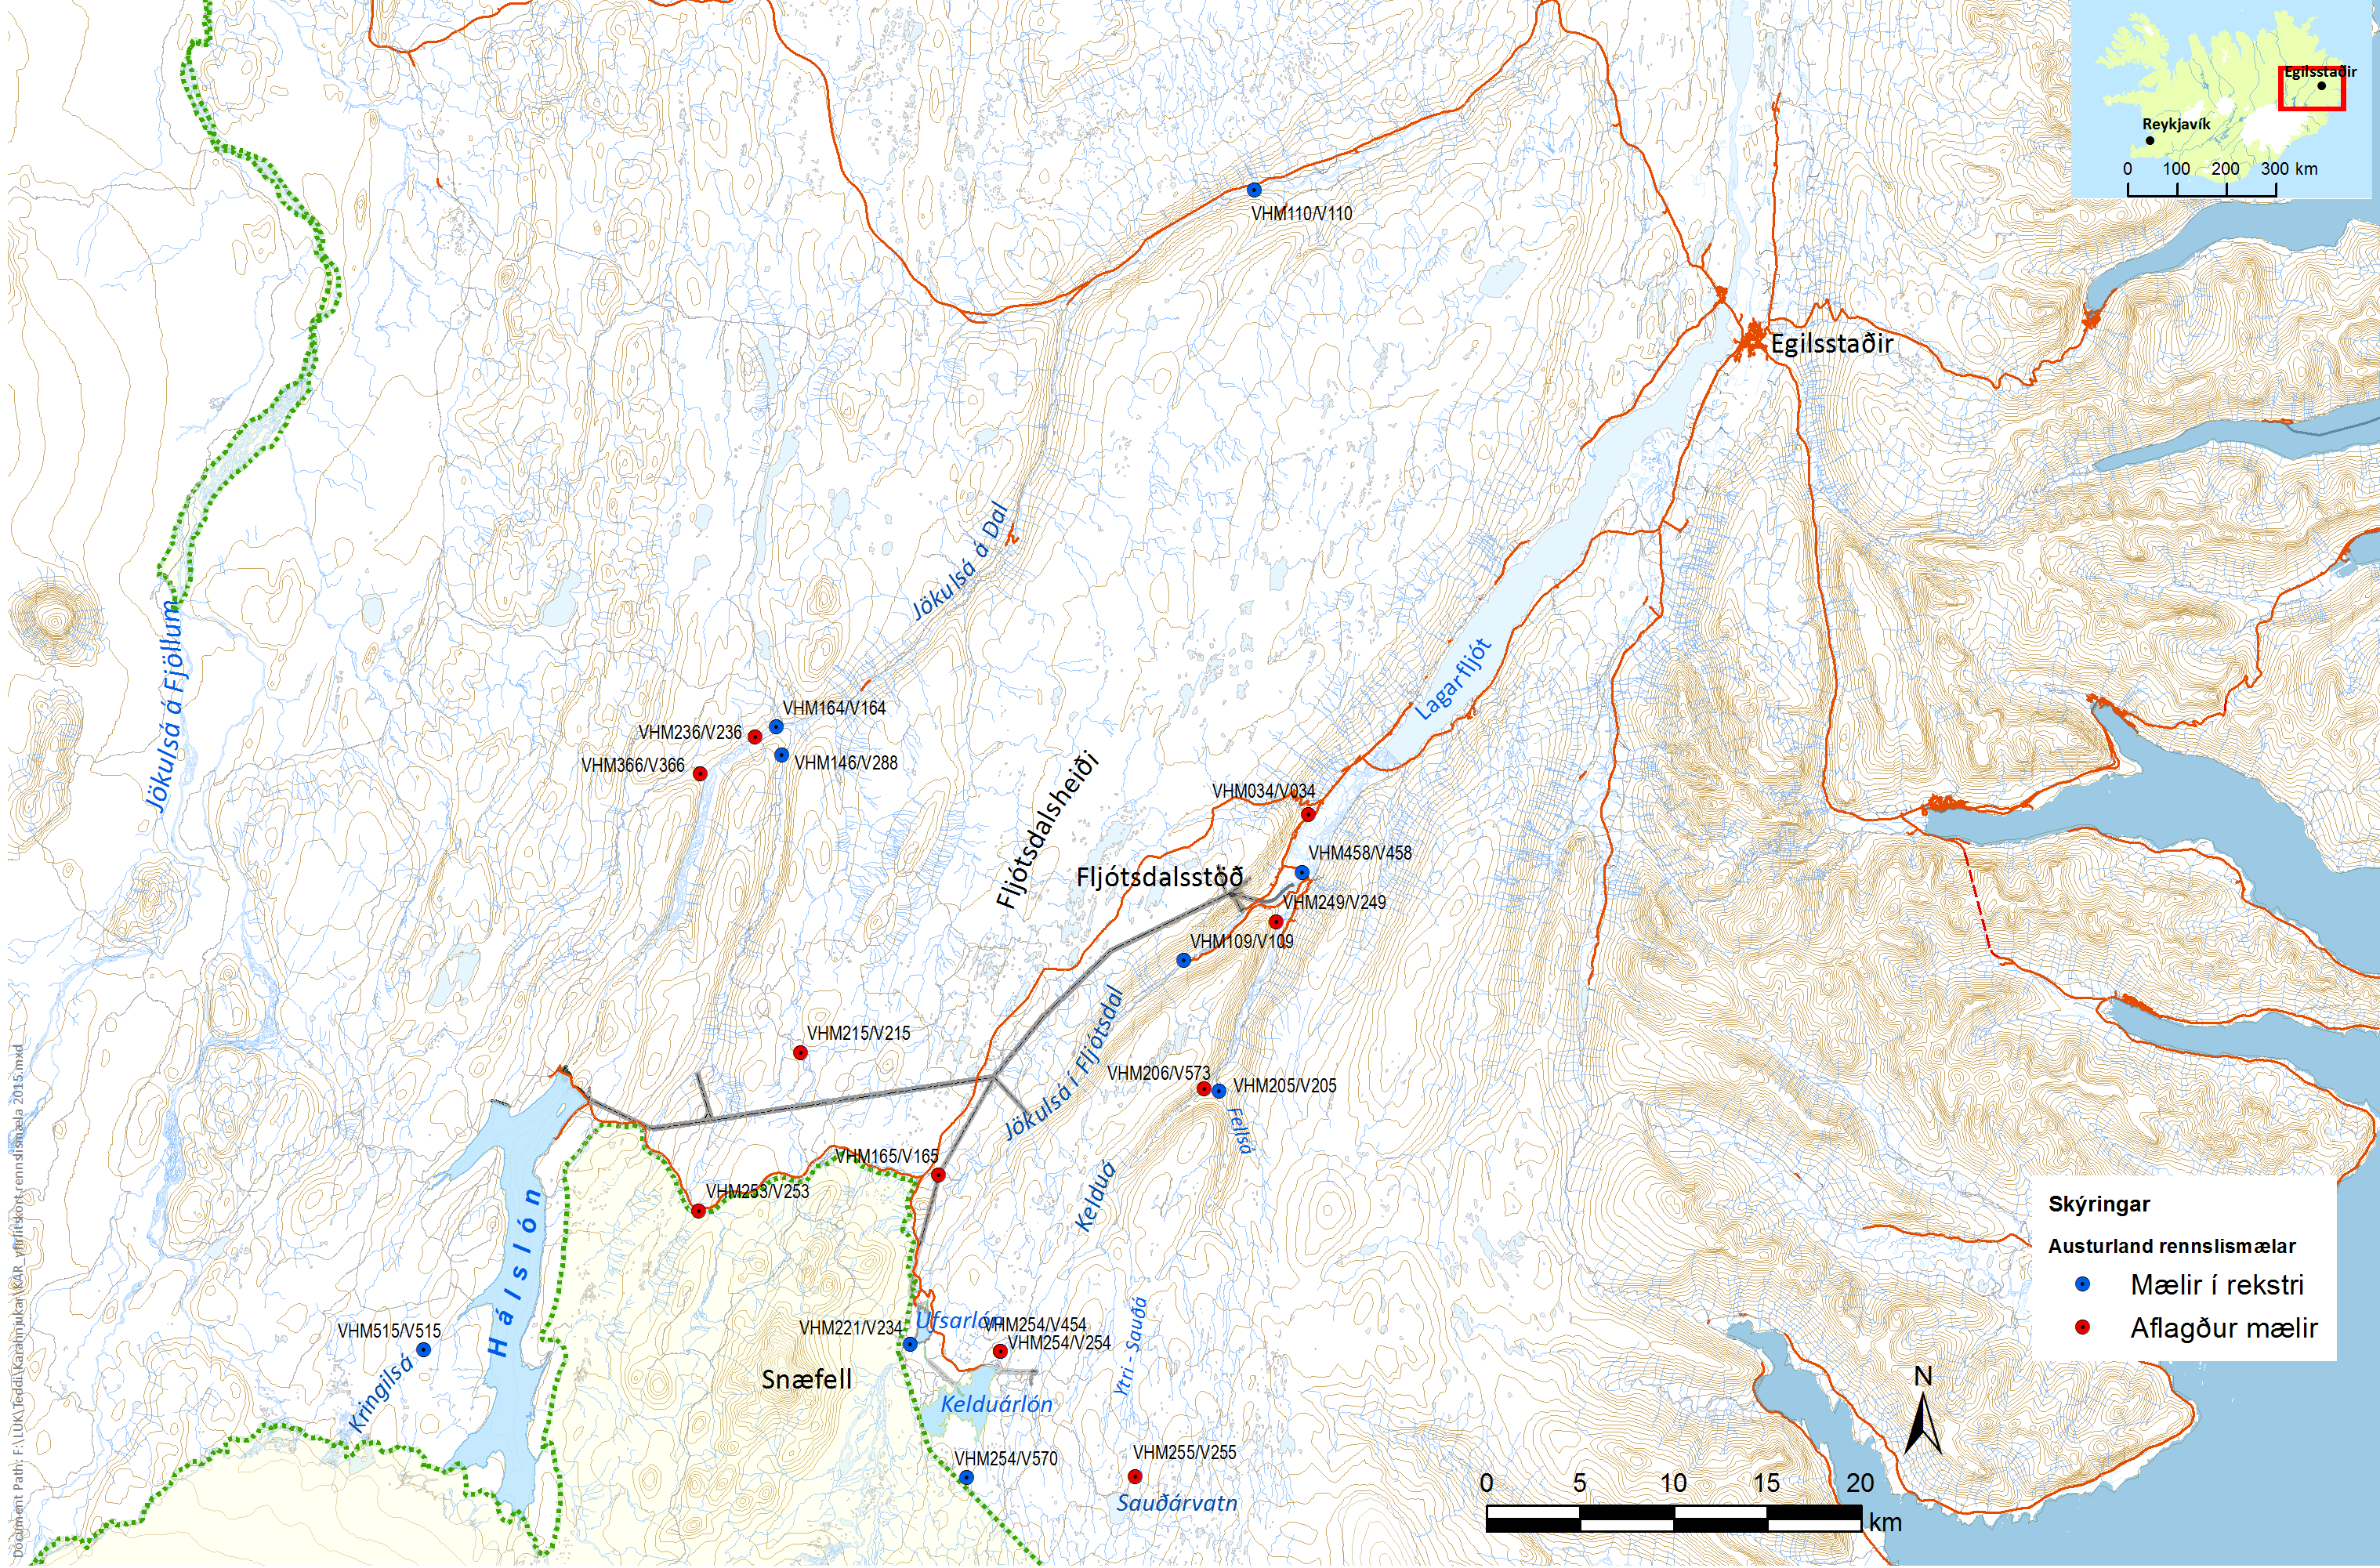
Figure 11. An overview map of flowable meters in East Iceland, meters in operation, and discontinued meters.
Click to download a larger image
Updated: April 17th, 2020
Changes of indicator
This indicator was originally number 25.1. It was then named Changes in Hydrology and can be found under that number in the project documents from 2005 and 2006.
The indicator number has been changed twice.
| Year | Nr. | Indicator name |
|---|---|---|
| 2020 | 2.1.2 | Water level and flow in rivers |
| 2007 | 2.2b | Changes in Hydrology |
Baseline
Information on water level and discharge at monitoring stations in rivers are available for different periods. Since the Lagarfoss power plant began operation in 1975, the water level in Lagarfljót river has been kept up to 0.5 m higher from October to March each year.
Figures in this section show discharge and water levels before the onset of the Kárahnjúkavirkjun power plant. Figures 12 – 14 show a grey shaded area between the recorded min and max discharge/water level and average discharge/water level.
In figure 15 probability of deviation from mean is also reported. Deviation from such probability distribution is the best criterion to pick up change but cannot be employed until the plant has been operating for at least 5 – 10 years.

Figure 12. Annual fluctuation of discharge in Jökusá á Dal river by Hjarðarhagi, vhm 110, before Kárahnjúkavirkjun power plant, 1963-2006
Labels: Shaded area: Annual fluctuation of discharge 1963 - 2006; Grey line: Average 1963 – 2006; Blue line: Measurements in 2007; Comment: Ice in riverbeds often interferes with discharge during winter. Winter measurements are only from 1998 - 2006.

Figure 13. Annual fluctuation of discharge in Lagarfljót river by Lagarfoss 1975 – 2006
Labels: Shaded area: Annual fluctuation in discharge: 1975 – 2006; Grey line: Average discharge: 1975-2006; Y-Axes: Average 24 hour discharge (m3/s).

Figure 14. Annual fluctuation of water level in Lagarfljót river by Lagarfoss 1977 – 2006.
Labels: Shaded area: Annual fluctuation in water level 1977-2006; Grey line: Average water level; Y-Axes: Average 24-hour water level (m a.s.l.).

Labels: Shaded area: Annual fluctuation in water level 1977 - 2006. Red line: median; Y-Axes: Average 24 hour water level (m a.s.l.)
Rationale for Indicator Selection
With the construction of the Karahnjukar power station, the river Jokulsa in Dal will be diverted from Halslon Reservoir into Jokulsá in Fljótsdal and Lagarfljot. Water from Jokulsá in Fljótsdal and rivers in the Hraun area will also be diverted to the power plant. This has caused substantial changes in the hydrology of the area. Water discharge would increase in some areas but decrease in others. Water level changes, which can affect groundwater level, sediment transport, changes in erosion, and so on, can also occur.
The discharge of the rivers Jokulsá in Fljótsdal, downstream of the tailrace canal, and Lagarfljot will increase considerably, on average just less than 90 m3/s. The mean annual discharge at Egilsstadir will increase by about half with the construction of the power plant.
The increase in discharge differs within the year. It is highest in winter (around 100 m3/s increase), but much less during the period of maximum discharge in summer when the power plant mainly utilizes water from Jokulsá in Fljótsdal and rivers in the Hraun area. Increased discharge in floods will be proportionally much less.
In worst-case scenarios in floods (all reservoirs full), the discharge of Jokulsá in Fljótsdal and Lagarfljot will increase by about 60 m3/s. In the largest recorded floods in Lagarfljót (October and November 2002), the maximum discharge was estimated at 1,650 – 1,700 m3/s. Maximum discharge at the Lagarfoss waterfall in the same floods was measured at 950 m3/s. The increase in maximum discharge into Lagarfljot and the flow by Lagarfoss waterfall are caused by dissemination effects of the lake by Egilsstadir. The Fljótsdalur Power Station increases the flow to Lagarfljót river in floods by around 3-4%. After the water has leveled in the Lagarfljót river, the level by Lagarfoss increases by 30 m3/s (goes from around 950 to around 980 m3/s) a.
Just as discharge increases in the rivers Jokulsá in Fljótsdal and Lagarfljót, it is considerably reduced in the river Jokulsá in Dal. The mean discharge is reduced for most of the year, although least during summer and into the autumn when it is likely that water will be discharged over the spillway of the Kárahnjukar dam. Floods due to glacial melt during summer are significantly reduced until August, when the Halslón Reservoir fills up. Typical autumn-, winter- and spring floods in the lower part of the river are only minimally reduced, as these originate mainly from the river catchment's area below the Kárahnjúkar dam. The same applies to the Jokulsa in Fljótsdal upstream of the tailrace canal.
a: Updated from original terms
From phase I/II report on indicators and baseline from April 2005
Further reading
LV-2017-024 Kárahnjúkavirkjun - Framkvæmd skilyrða fyrir virkjunarleyfi
Eftir 10 ára rekstur Kárahnjúkavirkjunar þykir tímabært að fara yfir það hvernig Landsvirkjun hefur höndlað ýmis skilyrði sem sett voru fyrir leyfi til virkjunar. Þessi skilyrði eru aðallega þrennskonar; skilyrði sem umhverfisráðherra setti í tengslum við úrskurð sinn um mat á umhverfisáhrifum, fyrirheit Landsvirkjunar í matsskýrslu og viðbótarskilyrði iðnaðarráherra í virkjunarleyfi. Skilyrðunum má skipta í rannsóknir og vöktun og aðgerðir til að vinna gegn ætluðum umhverfisáhrifum. Í meginatriðum er markmið rannsókna og vöktunar að ganga úr skugga um hver umhverfisáhrifin eru í raun og hvort þau eru í samræmi við það sem álitið var eða meiri eða minni? Í þeim tilfellum þar sem mögulegt er að draga úr áhrifum er því lýst hvernig það hefur verið gert, í öðrum tilvikum hvernig aðferðir hafa verið þróaðar til að fást við áhrif svo sem af áfoki, sem frá upphafi var helsta áhyggjuefni um illviðráðanleg umhverfisáhrif. Mótvægisaðgerðir hafa gefið góða raun svo langt sem þær ná, en ekki hefur í öllum tilvikum reynt á þær, svo sem við firnamikið áfok.
You can view more material related to the indicator by clicking on the link above.