
Progress
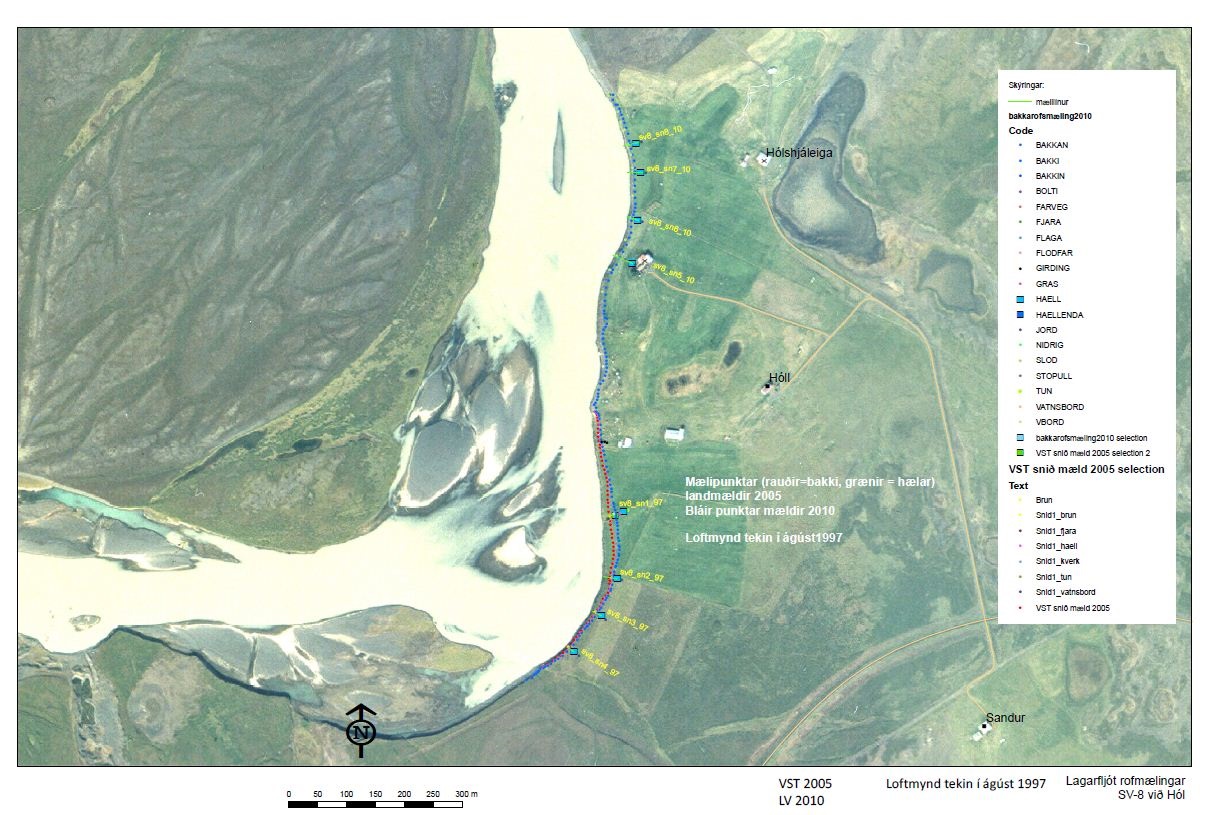
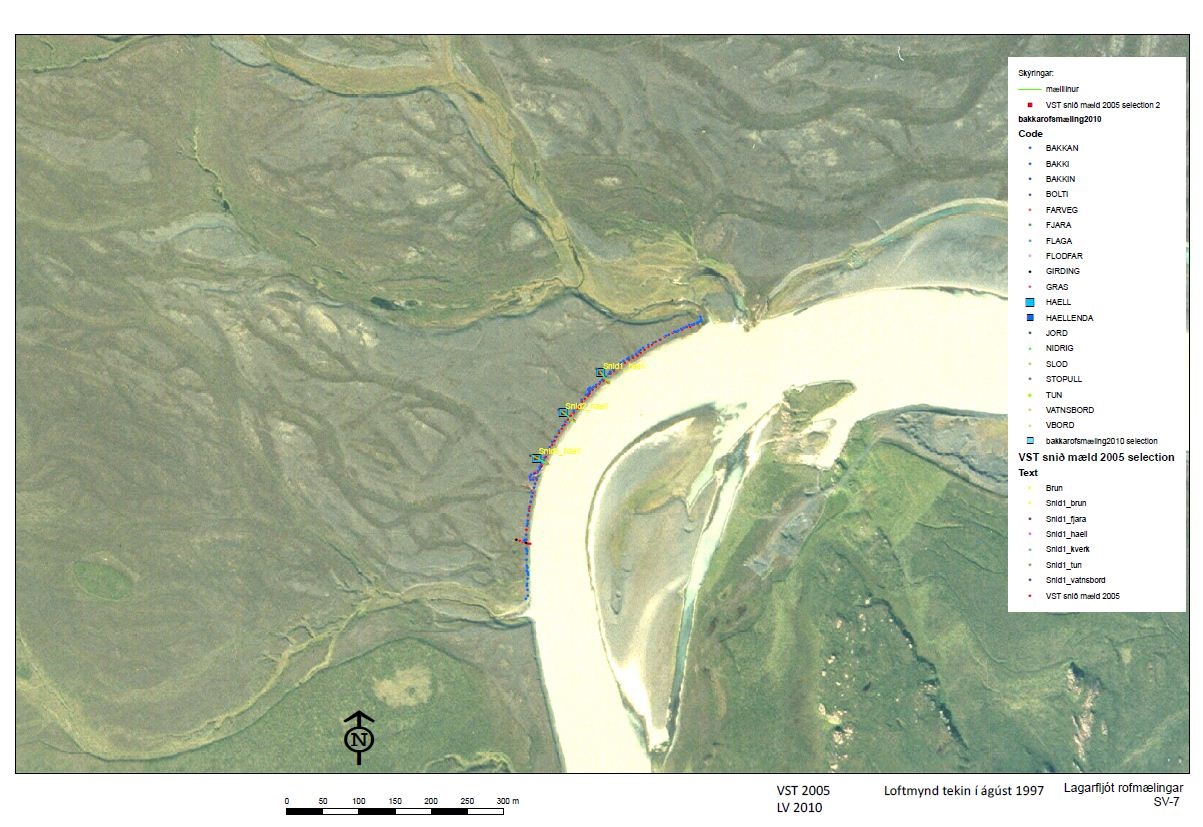
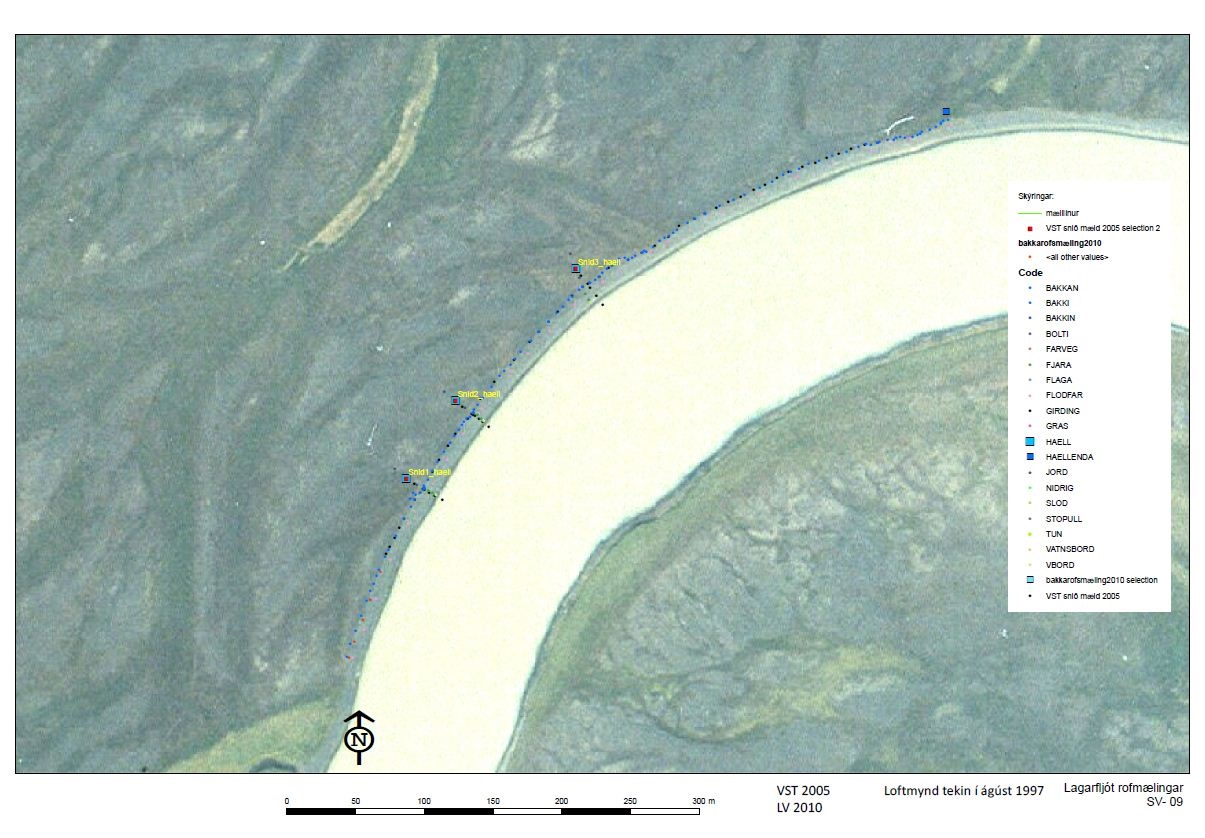
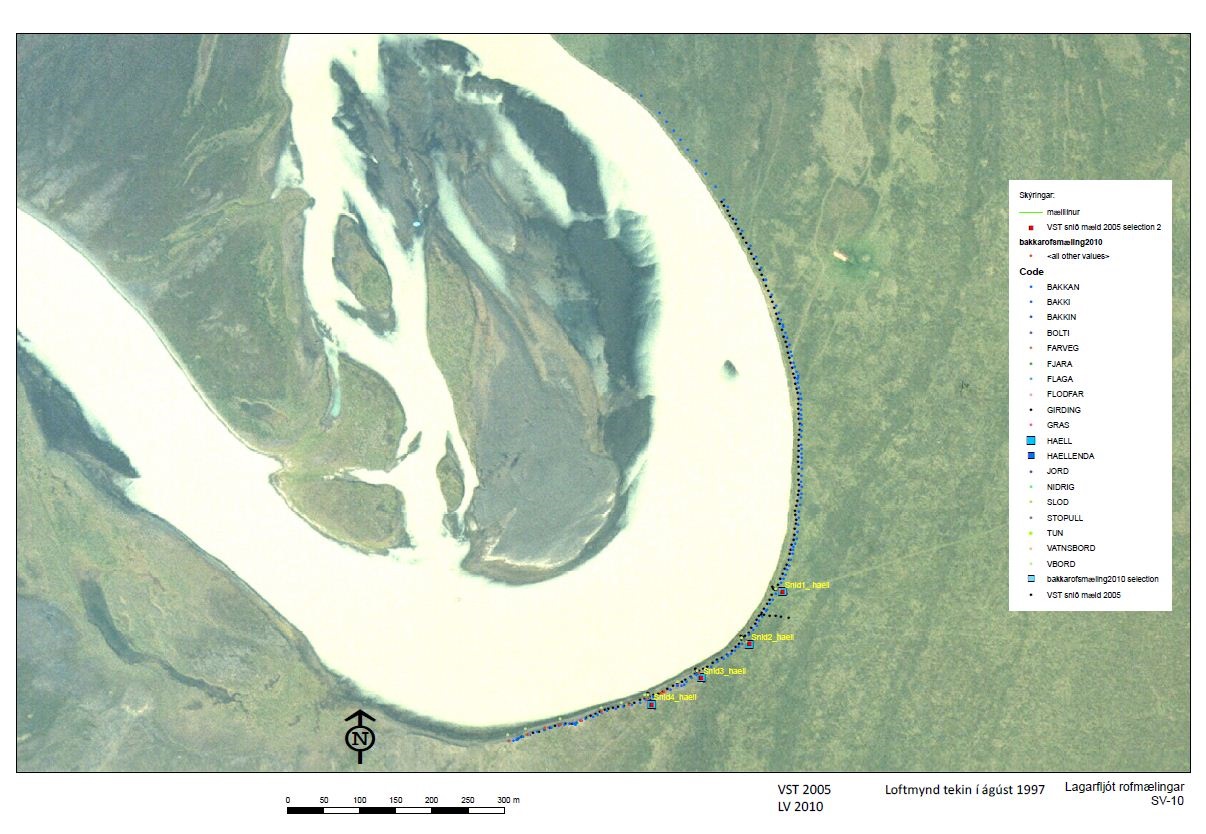
Riverbank erosion at Lagarfljót river above Steinbogi, rock arch, towards Lagarfoss waterfall seems limited and local. However, downriver from Steinbogi, Lagarfljót flows in a winding channel. The nature of such channels is that while erosion occurs in the outer banks, land formation occurs in the inner banks. Therefore, erosion has always been ongoing in this area compared to what aerial photos show. Most erosion is visible by Hóll, the farm, and the east side river bank curve opposite Grænanes.
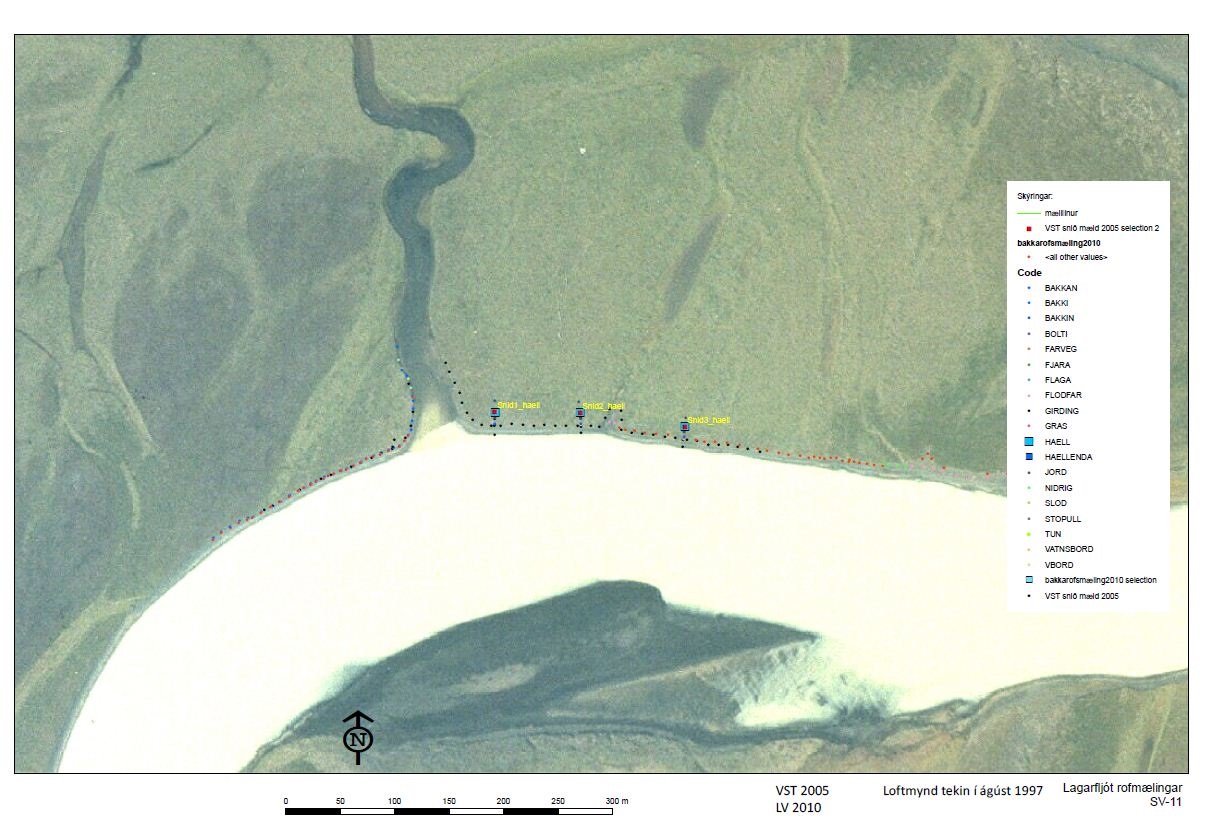
An appraisal was made in August 2012 on the condition of the banks of rivers Lagarfljót and Jökulsá in Fljótsdalur. The Soil Conservation Service of Iceland conducted the assessment and focused on the riverbanks' type, height, inclination, and land erosion. The total length of riverbanks examined was 211.5 km. Here, you can see an overview of the erosion of the Lagarfljót River, and the appraisal results can be seen here.
Table 1 shows the results of measurements of bank erosion at several sites along the river Lagarfljót. The progression of erosion in areas around the river is examined annually. Last year, most of the erosion was in area 8, south of Hóll. The riverbank was rock-protected in 2018, and numbers have been removed from the table.
| Area / Year | Erosion from 2005 to 2023 | Erosion 2022-2023 |
|---|---|---|
| Area 7: Vatnavik Steinboga – Profile 1 | 8,4 | 0,8 |
| Area 7: Vatnavik Steinboga – Profile 2 | 7,6 | 0,5 |
| Area 7: Vatnavik Steinboga – Profile 3 | 4,8 | 1,5 |
| Area 9: West bank by Hóll - profile 1 | 5,3 | 5,3 |
| Area 9: West bank by Hóll - profile 2 | 0,3 | 0,2 |
| Area 9: West bank by Hóll - profile 3 | 0,5 | 0 |
| Area 10: East bank by Grænanes - profile 1 | 6,9 | 0,6 |
| Area 10: East bank by Grænanes - profile 2 | 10,8 | 1,2 |
| Area 10: East bank by Grænanes - profile 3 | 8,3 | 0,9 |
| Area 10: East bank by Grænanes - profile 4 | 8,0 | 0 |
| Area 11: By Silungakíll in Kílamýri - profile 1 | 1,7 | 0,6 |
| Area 11: By Silungakíll in Kílamýri - profile 2 | 6,6 | 0,1 |
| Area 11: By Silungakíll in Kílamýri - profile 3 | 2,3 | 0 |
Updated: May 29, 2024
Source: Landsvirkjun 2024
Metrics, Targets and Monitoring Protocol
Metrics: What is measured?
Location of riverbank in selected areas as measured by riverbank profiles. (Project effect: indirect).
Monitoring Protocol
Annual measurements are taken from the reference point (stick) to the riverbank. In parallel, photos are taken of the riverbank.
Targets
To monitor possible erosion and, if needed, to interfere with the development with riverbank protection.
Possible countermeasures
If erosion is found in river banks, it interferes with riverbank protection.
Changes of indicator
In the annual general meeting 2019, a change in wording was approved.
| Original text | Changed text |
|---|---|
|
Profiles are taken of the riverbank in selected places and marked on a map. Measurements taken every five years. |
Annual measurements are taken from the reference point (stick) to the riverbank. In parallel, photos are taken of the riverbank. |
The rationale for the change: Sticks were put down in 2005 as a zero point. Sticks can be lost, and then a new zero point is set. Measured annually.
This indicator was originally number 18.1 and was then part of the indicator Erosion of the River Bank at Jökulsá á Fljótsdal, and Lagarfljót and can be found under that number in documents of the project from 2005 and 2006.
The indicator number has been changed twice.
| Year | Nr. | Indicator name |
|---|---|---|
| 2020 | 2.2.1 | Riverbank erosion |
| 2007 | 2.4 | Riverbank Erosion at Jökulsá í Fljótsdal and Lagarfljót rivers |
Baseline
In a few places along Lagarfljót, upriver from Lagarfoss, erosion of the riverbanks has been monitored by RARIK since the construction of Lagarfoss Hydroelectric Plant. This has been done as a part of the monitoring of vegetation. Thus, some knowledge exists about baseline in this area. This monitoring has been taken place by measuring the distance between the riverbank and 13 vegetation study plots that are located in 7 areas by the river Lagarfljót. Erosion differs considerably between areas, and it is heaviest north of Egilsstadir, especially close to the farms at Dagverdargerdi and Rangá 1.
In 2005 baseline was measured in the places along Lagarfljót, downriver from Lagarfoss, where there is some erosion danger. These measurements will be repeated in the spring of 2009 to compare with measurements from 2005 and decide if action is needed.
See report: LV-2005/087 (Icelandic only):
Rationale for Indicator Selection
The Kárahnjúkar dam will increase the flow of the rivers Jökulsá in Fljótsdalur and Lagarfljót which in turn can influence the potential for erosion of riverbanks. The mean annual discharge of the two rivers will increase by slightly less than 90 m3/s. This increase will roughly double the mean annual discharge at Egilsstadir. The increase in discharge will be significantly less during floods. Flow velocity will increase, which can lead to increased erosion of the riverbanks.
This erosion will mainly take place during floods when the impact of the Kárahnjúkar project is relatively small and flow speeds are only slightly increased. Considerable erosion of riverbanks already exists, particularly in certain areas downstream from Lagarfoss waterfall, but also to a certain degree in Jökulsá in Fljótsdalur.
The increased discharge will cause a rise in the water level, which also can cause increased erosion, especially where the flow velocity is low and erosion due to waves becomes the dominating factor. This is the case in Lagarfljót, upstream from Egilsstadir, and to a certain amount downstream from Lagarfoss waterfall. Erosion due to waves is already taking place along Lagarfljót.
Ice can also cause riverbank erosion. The Kárahnjúkar project is not expected to have much impact on the formation of ice on Lagarfljót. The potential impact of the power station will indirectly affect ice-related riverbank erosion due to the rise in the water level during winter, which can cause erosion by the presence of ice higher on the river banks. This only applies to the area downriver from Lagarfoss. Conversely, the water level will be lower in the area between Lagarfoss and Egilsstadir, so the effect there will be opposite.
From phase I/II report on indicators and baseline from April 2005
Further reading
LV-2023/055 - Landbrot á bökkum Hálslóns í Krintilsárrana.
Landgræðslan hefur annast mælingar á landbroti við strönd Hálslóns í Kringilsárrana frá árinu 2013 að beiðni Landsvirkjunar. Venjan er að mælingar fari fram á um 10 km kafla af strandlengju Kringilsárrana en í ár stóð til að sleppa svæðinu sunnan Hrauka. Áætlað var að mæla og skrásetja landbrot á tveimur dögum en vegna veðuraðstæðna var aðeins fært í Ranann annan daginn og því náðist einungis að mæla nyrsta hluti svæðisins þ.e.a.s. upp með Kringilsánni og stuttan spöl suður með austurbakka Ranans. Að auki bilaði
tækjabúnaður og því var ekki mælt eins langt inn með Kringilsánni og venjan er. Úttektin sumarið 2023 náði því einungis til rúmlega 3,3 km af strandlengjunni og flokkaðist 36,8% með mikið landbrot, 36,9% með talsvert landbrot, 10,7% með lítilsháttar landbrot og 15,6% með mjög lítið eða ekkert landbrot. Ekki voru umtalsverðar breytingar á landbrotinu á þessum hluta strandlengjunnar frá síðasta ári en þó var heldur minna landbrot upp með Kringilsánni en verið hefur.
You can view more material related to the indicator by clicking on the link above.