
Progress
According to Landsvirkjun's report on monitoring of Héraðsflói bay's coastline, it is roughly in balance, which means that it can potentially move forward about 100 m and partly back decades later. A baseline measurement was carried out in 2006, and the aim will be to measure the shoreline at Héraðsflói in 2026 in a similar way as stated in report LV-2008/067 (only in Icelandic). Figure 1 is from Landsvirkjun's report and shows 60 years of development of the coast based on a "balanced state". The river mouth can shift 3 km, and the coastline moves forward or retreat 100 - 200 m. Further information can be found in Landsvirkjun's report LV-2008/067 (only in Icelandic).
. Ósinn var færður 2014 og hefur nú fest sig í sessi á nýja staðnum og sá gamli hefur lokast.")
Figure 1. 70 years of development of the coastline. In 2014, the river mouth had moved (Icelandic only) 1.3 km compared to the location before the Kárahnjúkavirkjun power plant. It shifted about 3 km further north than ever since the middle of the last century. The new river mouth is now entrenched in a new position, and the old one has closed.

Figure 2. The coastline of Héraðsflói bay. The image was taken by drone in 2016 by Svarmi ehf.
On an enlarged image (click on the picture), the measurement from 2006 is in the drone image taken in 2016. The northern part of the coastline has moved around 130 – 150 meters in 10 years. Then the location of the river mouth (which was dug in 2014) and the southern part of the coastline is unchanged or slightly further out.
Updated: March 24, 2022
Source: Landsvirkjun 2022
Metrics, Targets and Monitoring Protocol
What is measured?
Location of shoreline as measured by aerial photographs and cross-sectional bathymetric surveys. (Project effect: indirect).
Monitoring Protocol
Aerial photographs and cross-sectional bathymetric surveys. Information gathered every 10 to 20 years.
Targets
The location of the shoreline will not change more than 280 m in one century as predicted by the model.
Possible countermeasures
Not applicable, monitoring only.
Changes of indicator
This indicator was originally number 29.1. It was then named Movement of Coastline and can be found under that number in documents of the project from 2005 and 2006.
The indicator number has been changed twice.
| Year | Nr. | Indicator name |
|---|---|---|
| 2020 | 2.2.2 | Coastline of Héraðsflói bay |
| 2007 | 2.6 | Changes in the Coastline of Héraðsflói bay |
Baseline
Staðsetning strandlínu Héraðsflóa.

According to a report LV-2008/067 (Icelandic only) on the monitoring of Héraðsflói coastline, it is relatively stable, which means that the coast can extend for about 100 m and then, decades later, retreat partly. The baseline study was performed in 2006 and the monitoring protocol plans the next data collection after 10-20 years, or in 2016-2026. The photo on the right, taken from the report, shows 60 years of evolution of the coastline based on "a stable condition." The mouth of the river can move for about 3 km and the coastline extends or retreat by 100-200 meters.

Aerial photographs and other photographs exist, showing the past changes of the coastline. In conjunction with the environmental impact assessment of the Kárahnjúkar project, geological and vegetation maps of the coastline have been produced, and cross-sectional bathymetric surveys conducted. Onshore and offshore fauna and human use of marine resources have been surveyed. In the fall of 2006 transect measurements on land were added as well as analysis of the coastline itself.
Rationale for Indicator Selection
With the Fljótsdalur power plant, the two glacial rivers will carry much less sedimentation to the shore than before and this can affect the location of the shoreline and vegetation close to the shore. The lowland of Úthérað area is largely formed by the two glacial rivers running there, Jökulsá á Dal river and Lagarfljót river. Of those, Jökulsá á Dal carries considerably more sediment, estimated to be around 7–8 million tons per year. Most of this sediment is carried by the rivers to the sea.
The two rivers share the same river mouth at Héraðsflói bay. The coastline of the bay and the position of the river mouth is affected by sediment transport of the two rivers and the erosive forces of the ocean waves. The river mouth has moved further north and it can be assumed that the beach is still moving further out. With the harnessing of Jökulsá á Dal river, the bulk of the sediment, around 6.0 million tons on average per year, will settle in the Hálslón reservoir. With the sediment transport of the rivers so largely decreased, the present balance of the coastline will be disturbed and it is projected that the shoreline will retreat. Sea level rise due to global warming will add to and accelerate the erosion of the shoreline.
According to erosion models, it is predicted that the shoreline will retreat around 280 meters in the first 100 years of operation of Fljótsdalur Power Station, primarily driven by rough seas and surf during storms and other situations such as rise in sea level. Destruction of vegetation on the shoreline is expected to be proportionally less than the area of land that will be eroded.
Updated: February 18, 2015
Original Rationale for Indicator Selection
With the Kárahnjúkar power plant, the two glacial rivers will carry much less sedimentation to the shore than under current conditions and this could influence the location of the shoreline and vegetation composition and cover close to the shoreline. The lowlands of Utherad are largely formed by the two glacial rivers running there, Jokulsá in Dal and Lagarfljot. Of those, Jokulsá in Dal carries considerably more sediment and the sediment transport is conservatively estimated to be around 7 – 8 million tons per year. The sediment transport of Lagarfljot is much less. Most of this sediment is carried by the rivers to the sea. The two rivers share the same river mouth at the shore of Herdasfloi Bay. The shoreline of the bay is affected by the sediment transport of the two rivers and the erosive forces of the ocean waves. At present, it can be assumed that the shoreline is advancing.
With the harnessing of Jokulsá in Dal, the bulk of the sediment, around 6.5 – 7.0 million tons per year, will settle in the Halslon Reservoir. With the sediment transport of the rivers so largely decreased, the present balance of the coastline will be disturbed and it is projected that the shoreline will retreat. Global sea-level rise will add to and accelerate the erosion of the shoreline.
According to erosion models, it is predicted that the shoreline will retreat around 280 meters in the first 100 years of operation of the dam, primarily driven by rough seas and surf during storms and other situations such as a rise in sea level. Destruction of vegetation on the shoreline is expected to be proportionally less than the area of land that will be eroded
From phase I/II report on indicators and baseline from April 2005
Further reading
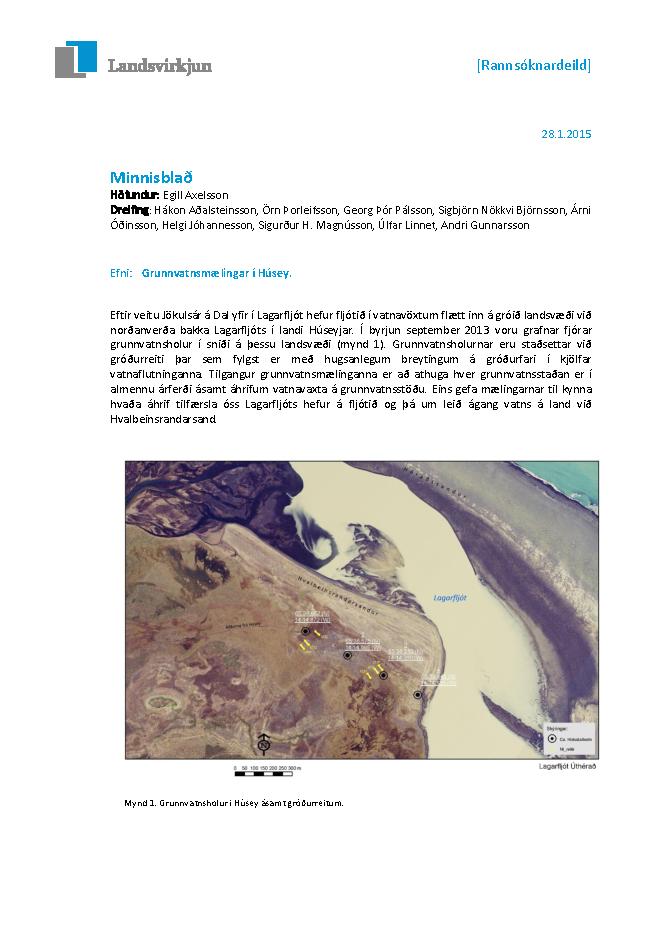
Minnisblað - Grunnvatnsmælingar í Húsey
Eftir veitu Jökulsár á Dal yfir í Lagarfljót hefur fljótið í vatnavöxtum flætt inn á gróið landsvæði við norðanverða bakka Lagarfljóts í landi Húseyjar. Í byrjun september 2013 voru grafnar fjórar grunnvatnsholur í sniði á þessu landsvæði (mynd 1). Grunnvatnsholurnar eru staðsettar við gróðurreiti þar sem fylgst er með hugsanlegum breytingum á gróðurfari í kjölfar vatnaflutninganna. Tilgangur grunnvatnsmælinganna er að athuga hver grunnvatnsstaðan er í almennu árferði ásamt áhrifum vatnavaxta á grunnvatnsstöðu. Eins gefa mælingarnar til kynna hvaða áhrif tilfærsla óss Lagarfljóts hefur á fljótið og þá um leið ágang vatns á land við Hvalbeinsrandarsand.
You can view more material related to the indicator by clicking on the link above.
A film about the transfer of the Lagarljót and Jökla estuary (expected).