
Progress
The groundwater measurements that are discussed here are related to, e.g. monitoring of groundwater level in Fljótsdalur and monitoring of vegetation in Úthérað. With the introduction of the Kárahnjúkar power plant, groundwater level changes were expected in the vicinity of Jökulsá in Fljótsdalur, below the drainage ditch of Fljótsdalsstöð, as well as in the area of Jökulsá á Dal and Lagarfljót in Úthérað. The groundwater level follows a changed water level near the streams, decreases at Jökulsá á Dal and increases at Lagarfljót. On the river banks, groundwater levels are accompanied by thawing and precipitation. Comparative measurements of the groundwater level in four measurement profiles in Fljótsdalur and Úthérað before and after the power plant have shown these changes. The measurements after power generation were confirmed by additional measurements in 2015 and 2016. No further need for measures is considered in the mentioned four measurement formats, and those measurements have been discontinued.
Since 2013, the groundwater level in four groundwater wells at Torfulón in the land of Húsey has been monitored. It was clear that land there had become wet after the supply of Jökulsá á Dal to Lagarfljót. In 2014, the Lagarfljót estuary was moved. With that operation, the groundwater level at Torfulón dropped by up to 30-40 cm memorandum from May 28, 2020 (Icelandic Only). Measurements of the groundwater level at Torfulón will be continued while vegetation changes in these areas are monitored.
Four gauging stations were established to measure groundwater levels in holes close to rivers. The comparison basis for measuring groundwater level is based on data from 2000-2007 before the power plant and the data after the power plant, from 2008, 2010 - 2011, and 2015-2016 (Icelandic only).
For Valþjófsstaðanes, two pictures are shown; individual weekly measurements over three periods; two before and two after activation (Figure 1), compared to the continuous registration of a water level in the relevant waterfall. On the other hand, the classic presentation is the average of measurements in each hole (Figure 2) and for Bessastaðanes and Hól (Figures 3 and 4). Those pictures have not been updated, nor have pictures of measurements at Hólmatunga (pictures 5 and 6).
Valþjófsstaðanes
, FLJ2 (rauðir punktar) og FLJ3 (grænir punktar).")
Figure 1. The groundwater level in holes in Valþjófsstaðanes FLJ1 (blue dots), FLJ2 (red dots), and FLJ3 (green dots).
 og eftir virkjun (2010 - 2011)")
Figure 2. Groundwater at Valþjófsstaðanes before power plant (2001 - 2007) and after power plant (2010 - 2011)
Labels: Y-axis: Groundwater level (m a.s.l.), x- axis: Distance (m). Vegur - road, Farvegur - river channel.
Bessastaðanes
 og eftir virkjun (2010 - 2011)")
Figure 3. Average water level observed in three holes before (2000-2007, blue) and after (2010-2011, red) construction of power plant compared to ground level (black line) in holes BES 1-3.
Labels: Y-axis: groundwater level (m a.s.l.), x- axis: Distance (m). Farvegur = river channel.
Við hól á Úthéraði
 og eftir virkjun (2010 - 2011)")
Figure 4. Average water level observed in five holes before (2000-2007, blue) and after (2010-2011, red) construction of power plant compared to ground level (black line).
Labels: Y-axis: groundwater level (m a.s.l.), x- axis: Distance (m). Farvegur = river channel.
Hólmatunga
Results from groundwater level analysis at Hólmatunga are shown in two graphs. The upper graph shows Individual weekly observations over two periods before and after the construction of the Kárahnjúkavirkjun power plant compared to continuous observations on the water level of the Jökulsá á Dal river (Figure 5). Observations were made during the summer when the water level in the Jökulsá á Dal river was lowest. During summer, the groundwater level falls about 40 - 60 cm at 600 - 1300 m distance from the river, compared to the 30-35 cm average value for the whole period.

Figure 5. The water level at Hólmatunga
 og eftir virkjun (2010 - 2011)")
Figure 6. Groundwater level by Hólmatunga before (2000-2007, blue) and after (2010-2011, red) construction of power plant compared to ground level (black line).
Labels: Y-axis: groundwater level (m.a.s.l.), x- axis: Distance (m). Farvegur = river channel.
Results
Measurements are generally based on recording gauges in specific holes and weekly measurements during specific periods in other holes on the same Gauging stations. This provides information about the relationship between groundwater levels on flat land, discharge in the closest river, and precipitation.
- The adjacent river impacts the groundwater table on the flat vegetated land water level, which can refer to at least 700-800 m from the river.
- The groundwater table is more influenced by rainfall in a sloping end close to the foot a-of a slope. This has not changed after the construction of the power plant.
- As expected, the groundwater table in both Jökulá í Fljótsdal river and Lagarfljót river has risen but subsided in Jökulsá á Dal river.
- It was assumed that the plant could cause up to a 25 cm rise in groundwater in Valþjófsstaðanes. Given the topography and the depth of groundwater in areas adjacent to the Jökulsá í Fljótsdal river, it was expected that the ground would get wetter if nothing were done. To counteract this, the drainage canals were cleared and deepened, and water was pumped from them to Jökulsá í Fljótsda river. If nothing had been done, the groundwater table would probably be about 1 m higher in Valþjófsstaður peninsula and probably the lowest underwater areas.
Updated: April 7, 2022
Source: Landsvirkjun (2022)
Metrics, Targets and Monitoring Protocol
What is measured?
Groundwater levels in holes. (Project effect: indirect). Measurements were repeated at regular intervals from 2009 to 2011.
The purpose of measurements is, i.a., to analyze the effects of the operation of the power plant from natural fluctuations.
Monitoring protocol
Four stations to measure groundwater have been located in wells close to the rivers. Two are in Fljótsdalur and two in Úthérad. There is digital equipment, a groundwater station, and a water level station that measures and registers the water level every hour in each gauging station. A report is piled every year for each station. The groundwater level is also measured manually in other holes at regular intervals.
The map below shows the measuring stations.

This map shows water level gauges in Jökulsá river in Fljótsdalur, used for measuring groundwater in flatlands by the river. The blue dots mean constantly measuring gauges in groundwater holes, and the black dots indicate groundwater holes that are measured manually.
Changed monitoring: Following the Icelandic Meteorological Office's report on a comparison of water levels and groundwater in the lowlands of Hérað and an assessment made of vegetation changes, it was decided to add one groundwater profile in the lowest areas out by Héraðssandur in Húsey. Furthermore, measurement at the top of the groundwater profiles was stopped. At present, it is only recommended in the new format at Húsey.
Updated: April 17th, 2020
Changes of indicator
This indicator was originally number 25.1. It was then named Changes in Hydrology and can be found under that number in the project documents from 2005 and 2006.
The indicator number has been changed twice.
| Year | Nr. | Indicator name |
|---|---|---|
| 2020 | 2.1.3 | Ground water levels in holes |
| 2007 | 2.2b | Changes in Hydrology |
Baseline
Measurements on groundwater levels in two measuring stations at Jökulsá in Fljótsdalur, one by Jökulsá river in Dal and one by Lagarfljót river. Measurements started in 2000 and were performed every week until the end of 2001 by the local people. Repeat gauges were placed in a few groundwater holes in 2003-2004. Local people started measuring again in the fall of 2005 and 2006 in holes that did not have repeat gauges.
The following figures show an example of the basic condition of one measuring station (borehole) in each profile in the years 2004-2007. It is the top station in three cases, i.e. the one furthest from the relevant watercourse. The groundwater level in these holes has proven to be independent of the water level in the streams. Still, it gives a good picture of natural changes in groundwater due to the weather (thawing and precipitation). Only in Bessastaðanes did it appear that the measuring meter had turned down in a hole under the influence of the water level of a nearby waterfall.
In other respects, reference must be made to the figures published in the performance section. The groundwater level after the power plant is compared with the groundwater level before the power plant and both in the relevant water level measurements in the next watercourse.
")
Figure 8. Groundwater level at Valþjófsstaðanes 2004-2007 (FLJ3)
")
Figure 9. Groundwater level at Bessastaðagerði 2004-2007 (BES2)
")
Figure 10. Groundwater level at Lagarfljót in Úthérað, Hóll 2004-2007 (LAG4)
")
Rationale for Indicator Selection
With the construction of the Karahnjukar power station, the river Jokulsa in Dal will be diverted from Halslon Reservoir into Jokulsá in Fljótsdal and Lagarfljot. Water from Jokulsá in Fljótsdal and from rivers in the Hraun area will also be diverted to the power plant. This has caused substantial changes in the hydrology of the area. Water discharge would increase in some areas but decrease in others. Water level changes, which in turn can affect groundwater level, sediment transport, changes in erosion, and so on, can also occur.
The discharge of the rivers Jokulsá in Fljótsdal, downstream of the tailrace canal, and Lagarfljot will increase considerably, on average just less than 90 m3/s. The mean annual discharge at Egilsstadir will increase by about half with the construction of the power plant.
The increase in discharge differs within the year. It is highest in winter (around 100 m3/s increase), but much less during the period of maximum discharge in summer when the power plant is mainly utilizing water from Jokulsá in Fljótsdal and rivers in the Hraun area. Increased discharge in floods will be proportionally much less.
In worst-case scenarios in floods (all reservoirs full), the discharge of Jokulsá in Fljótsdal and Lagarfljot will increase by about 60 m3/s. In the largest recorded floods in Lagarfljót (October and November 2002), the maximum discharge was estimated at about 1,650 – 1,700 m3/s. Maximum discharge at the Lagarfoss waterfall in the same floods was measured at 950 m3/s. The increase in maximum discharge into Lagarfljot and the flow by Lagarfoss waterfall is caused by dissemination effects of the lake by Egilsstadir. The Fljótsdalur Power Station, therefore, increases the flow to Lagarfljót river in floods by around 3-4%, and after the water has leveled in Lagarfljót river, the level by Lagarfoss increases by 30 m3/s (goes from around 950 to around 980 m3/s) a.
Just as discharge increases in the rivers Jokulsá in Fljótsdal and Lagarfljót, it is considerably reduced in the river Jokulsá in Dal. The mean discharge is reduced for most of the year, although at least during summer and into the autumn when it is likely that water will be discharged over the spillway of the Kárahnjukar dam. Floods due to glacial melt during summer are significantly reduced until August when the Halslón Reservoir fills up. Typical autumn-, winter- and spring floods in the lower part of the river are only minimally reduced, as these originate mainly from the river catchment's area below the Kárahnjúkar dam. The same applies to the Jokulsa in Fljótsdal upstream of the tailrace canal.
a: Updated from original terms
From phase I/II report on indicators and baseline from April 2005
Further reading
Minnisblað - Grunnvatnsmælingar í Húsey
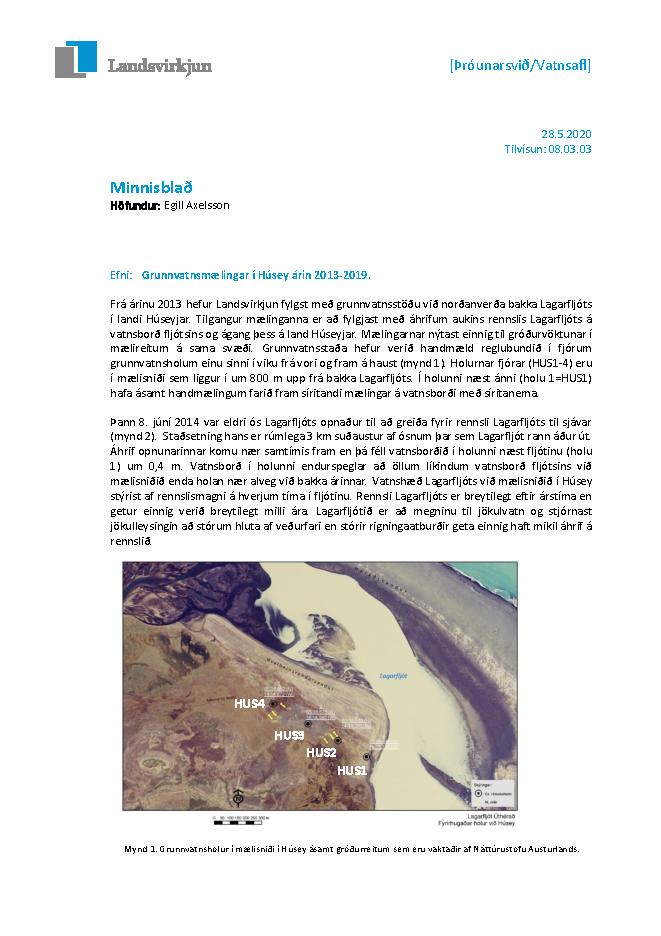
Frá árinu 2013 hefur Landsvirkjun fylgst með grunnvatnsstöðu við norðanverða bakka Lagarfljóts í landi Húseyjar. Tilgangur mælinganna er að fylgjast með áhrifum aukins rennslis Lagarfljóts á vatnsborð fljótsins og ágang þess á land Húseyjar. Mælingarnar nýtast einnig til gróðurvöktunar í
mælireitum á sama svæði. Grunnvatnsstaða hefur verið handmæld reglubundið í fjórum grunnvatnsholum einu sinni í viku frá vori og fram á haust (mynd 1). Holurnar fjórar (HUS1-4) eru í mælisniði sem liggur í um 800 m upp frá bakka Lagarfljóts. Í holunni næst ánni (holu 1=HUS1) hafa ásamt handmælingum farið fram síritandi mælingar á vatnsborði með síritanema.
You can view more material related to the indicator by clicking on the link above.